Brief Historical Context
Most of Iowa's prairies are a result of glaciation estimated at 12,000 years ago. This resulted in a fairly large portion of Iowa being inundated by standing water. This led to a high water table and rivers accustomed to having a wide-berth flood plain. In fact, approximately 6 million acres of agricultural cropland in Iowa where excess water can limit agricultural and therefore economic productivity (Hofstrand, 2010). While the result of this was rich fertile soil, high water was not conducive for agricultural cropland, at least not successful cropland anyway. Counties throughout the state began to develop methods of draining and diverting the water to access the rich soils; in comes tiling.
Tiling
Historical agricultural practices known as 'tiling' have resulted in often channelized water diversion systems beneath crop fields reducing the amount of standing water in the water table. The two images below show examples of how tiling affects the water table.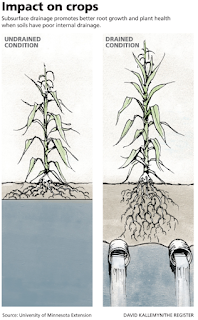


NRCS has provided a brief PDF document summarizing all of the above. This is a great PR tool to hand out to folks who are unsure of what exactly does Drainage Water Management mean, and how does it affect the producer overall. As stated on their website, reducing the input of materials into the system to begin with (fertilizers/pesticides) is the start, but realistically, moving to the next stage in the system will better reduce the amount of nutrients input into the system and is also a more attainable goal for farmers, while still maximizing their agricultural yield, and in some cases even increasing it.

For farmers, pooled surface water and elevated (natural) high water levels within the water table decrease crop success and yield. Tiling enabled them to effectively lower the water table, reducing the amount of water in the soil, allowing them to take advantage of the fertile soils. Tiling, however, also increases the rate in which nitrates are filtered from livestock lands and fertilizers and flow into larger creeks, eventually ending up in the Gulf of Mexico. In the video below, you will hear that one of the watersheds in Iowa (Raccoon River) has possible the highest nitrate content in North America solely due to tiling practices.
While tiling may not be ideal from a conservationist's perspective as it relates to natural water flow, storm water mitigation strategies and assessing flood risk, agricultural crop yields are an important part of our country's economy and well as individual livelihood. It is of utmost importance to work together to find long-term strategies to essentially retrofit existing tiles underneath agricultural lands as well as provide opportunities for farmers to implement tiling in a water-conscious and environmentally friendly way. On a personal note, I've found within the last year or so as a professional that there are times where you may just want to say, "this isn't the way to do this, you must stop" or "We're not going to do as you want, because it's not beneficial to the natural world". This approach is far from what we need as we can just look to the status of our nation as we continue to have more polarized views. I have found that working together to come up with a solution palatable to both sides (when possible) often yields better results/relationships.
Where do we go from here?
In the PBS video below - Comparison of Two Watersheds - Chris Jones, a Water Quality Research Engineer with the University of Iowa, discusses issues with nitrate and phosphorous levels in the Raccoon River Watershed in Iowa. State and federal funding are in the works to mitigate nitrate levels within the watershed.
The Iowa Nutrient Reduction Strategy was developed in 2012 in response to the Mississippi River/Gulf of Mexico Watershed Nutrient Task Force (est. 1997) attempting to reduce nutrient loads in the Gulf of Mexico. In their 2008 Action Plan, they requested each of the 12 states along the Mississippi to develop a nutrient reduction strategy. The Iowa Department of Agriculture and Land Stewardship, Iowa State University and the Iowa Department of Natural Resources worked together to develop this strategy. In November of 2012, the first Iowa Nutrient Reduction Strategy was drafted and has had four revisions since (2013, 2014, 2016, 2017). The goal of the INRS is to reduce the combined nutrient load of Nitrogen and Phosphorous by 45% annually. For more information on nutrient pollution in the Mississippi River Watershed, review this excellent overview online describing the adverse affects the Gulf has faced due to high nutrient level input from the watershed.
In summary, here are the preliminary results:
The 2006-2010 benchmark load serves as a baseline for just before when the Iowa NRS was established.
As I mentioned earlier, farmers do work together with extension agents to develop best management practices on their lands in efforts to reduce nutrient offloads from their tiled lands. . The Natural Resources Conservation Service (NRCS) has resources available online addressing nutrient loads, financial assistance, and conservation planning, among others. Under the Nutrient Management page, several options are listed as ways to reduce nitrogen outputs in waterways including reducing fertilizer/pesticide use, using cover crops/no-till methods to reduce erosion (thereby runoff), or implementing Drainage Water Management (DWM) systems. Retrofitting existing tiled lands can be done through DWMs, allowing tiling practice to continue, but reducing the overall output of nitrogen into watersheds. In some cases as reported by NC State University, drainage systems can even increase crop yields by installing DWMs. They conducted a 20-year study yielding a 10.4% increase in corn yield as well as positive yields in soybean fields as well.
I've found two examples of farmers working to reduce their farm's impact on watersheds:
In this article, a farmer in Northern Ankeny has implemented two of the nutrient reduction practices - installing a bioreactor and creating saturated buffers. The bioreactor uses a large container full of wood chips that acts as a filtration system. Water from the tiling system flows through it and microbes on the wood chips utilize the nitrogen from the incoming water, filtering the pollutant out. The saturated buffers divert the water from the tiling system into another tiling system that runs parallel to a vegetated buffer, allowing for smaller amounts of the filtered water to percolate out of the parallel system. The remaining nitrogen is up taken by the vegetation, removing it before it can reach the watershed.


Installation of a bioreactor. Image Source: Polk SWCD.
Another family in Northern Polk County also recently implemented a tiling system and a bioreactor on their farmland. For years they have been participating in nutrient mitigation strategies by installing buffer strips along water ways, have taken measures to reduce erosions and have installed grass waterways.
There are many programs in place to help offset the overall cost of implementing these structures on the landscape. In fact, USDA just granted $1 milllion to Iowa for assistance with another program - wetland mitigation banking - that is often unaffordable for agricultural producers.
NRCS has provided a brief PDF document summarizing all of the above. This is a great PR tool to hand out to folks who are unsure of what exactly does Drainage Water Management mean, and how does it affect the producer overall. As stated on their website, reducing the input of materials into the system to begin with (fertilizers/pesticides) is the start, but realistically, moving to the next stage in the system will better reduce the amount of nutrients input into the system and is also a more attainable goal for farmers, while still maximizing their agricultural yield, and in some cases even increasing it.
Sources for this post:
Hofstrand, D. 2010. Understanding the Economics of Tile Drainage. Iowa State University Extension and Outreach. Available from https://www.extension.iastate.edu/agdm/wholefarm/html/c2-90.html
INRC. 2020. Iowa Nutrient Reduction Strategy 2018-19 Annual Progress Report. Available from https://store.extension.iastate.edu/product/15915
Iowa PBS. 2018. Comparison of Two Watersheds. Available from http://www.iowapbs.org/iowalandandsky/story/31804/comparison-two-watersheds
NRCS. n.d. NRCS Iowa Home Page. Available from https://www.nrcs.usda.gov/wps/portal/nrcs/ia/home/


